Data Observability Platform (Independent Project)
This project is a production-style data observability platform. It ingests raw data, transforms it into a clean warehouse model, runs automated data-quality checks, and detects anomalies that open incidents. All dashboards read from secure database views, and access is enforced with Row-Level Security (RLS).
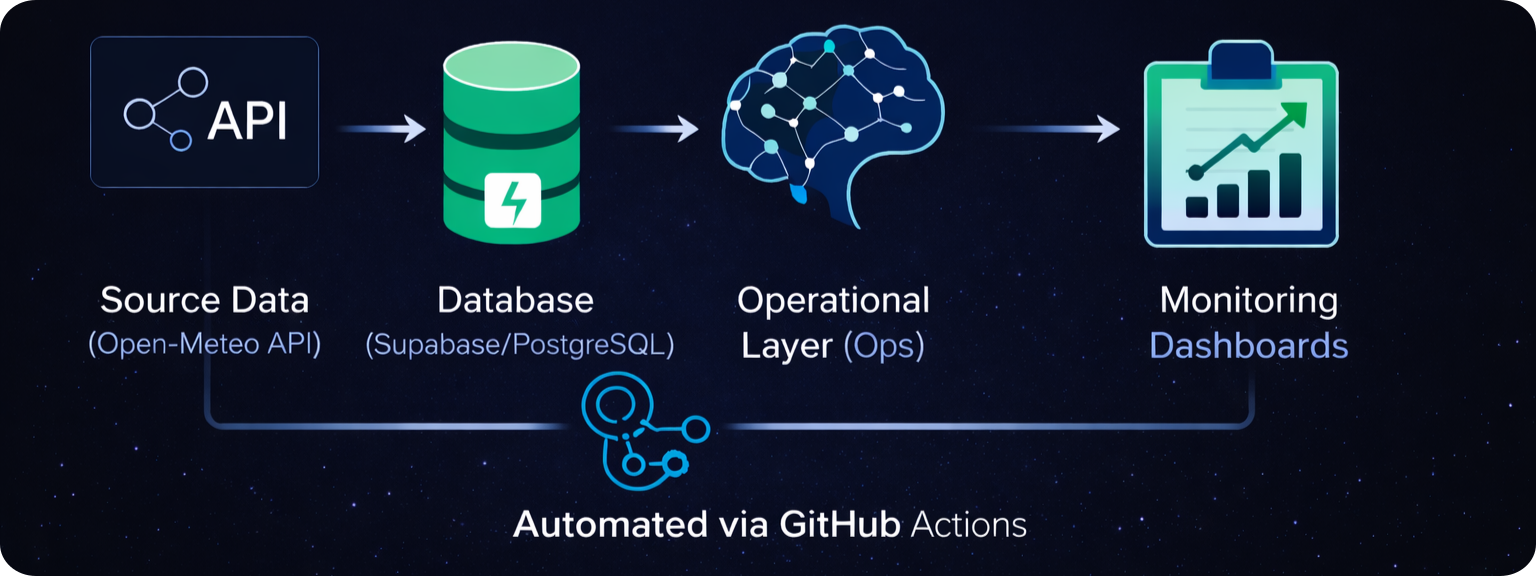
1. Architecture
End-to-end flow: source → ingest → warehouse → ops → dashboards.
2. Database Schema
Core tables, keys, and relationships used by the platform.
Tables and view layer that define how data is stored and queried.
3. Row-Level Security (RLS)
Access rules enforced in the database and verified by CI tests.
| Policies | Verification Tests | Automation (CI) |
|---|---|---|
| • RLS Policies | • RLS Verification Tests |
• RLS Test Workflow • RLS Test Status ☑ |
4. Monitoring & Operations
Dashboards, jobs, and automation for pipeline health and incidents.
| Live Dashboards | Jobs | Automation (CI) |
|---|---|---|
|
• Monitoring Dashboard • Incidents • Stations |
• Data Ingestion • Data Transformation • Data Quality Checks • Anomaly & Incident Handling |
• Jobs Workflow |
5. Data Contracts
Expected data shape and validation rules for ingestion and transforms.